As an experienced algorithmic trader, I understand the importance of mastering quantitative analysis in order to stay ahead in the dynamic financial markets. Quantitative analysis allows me to make data-driven decisions, develop effective trading strategies, and ultimately maximize profits in my algorithmic trading endeavors.
In this article, I will share my insights and knowledge on how to master quantitative analysis in algorithmic trading. From understanding mean reversion strategies to implementing them using Python, I will guide you through the essential steps to enhance your algorithmic trading skills.
Key Takeaways:
- Quantitative analysis is crucial for successful algorithmic trading.
- Mean reversion strategies rely on identifying and exploiting deviations from the average price.
- Python is a powerful tool for implementing algorithmic trading strategies.
- Data acquisition and exploration are essential for strategy development.
- Backtesting is necessary to evaluate the performance of your trading strategy.
Understanding Mean Reversion in Algorithmic Trading
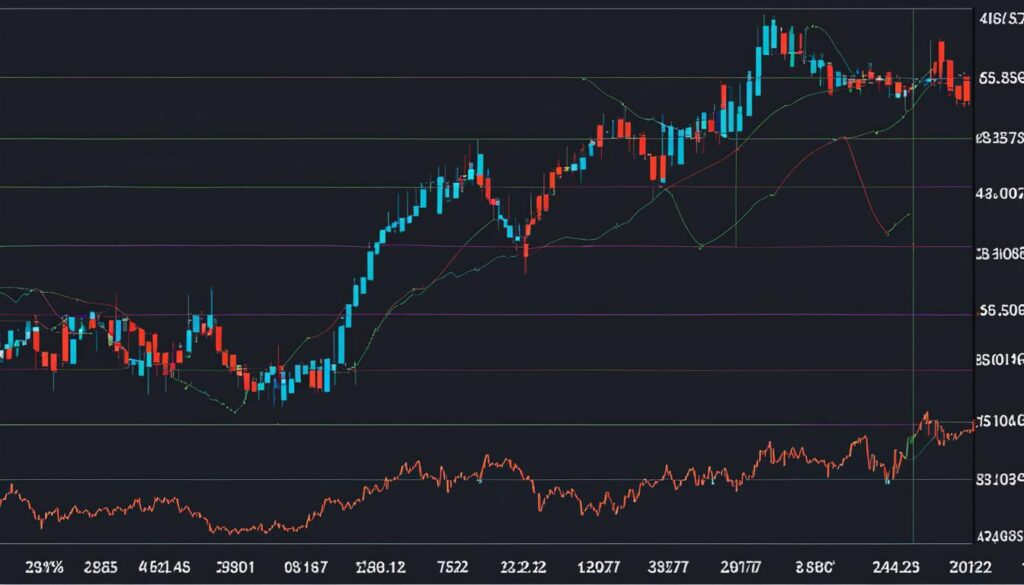
Mean reversion is a popular trading strategy in algorithmic trading that capitalizes on the tendency of asset prices to revert to their average value over time. By utilizing technical analysis, this strategy aims to identify when an asset’s price has reached an extreme and is likely to experience a correction.
Mean reversion algorithms analyze historical price data to identify assets that are significantly overbought or oversold. When an asset’s price deviates from its average value, these algorithms can trigger either a buy or sell order, anticipating a reversion of the price back towards its mean.
This strategy is particularly effective in ranging markets where prices fluctuate within a certain range. It allows traders to take advantage of short-term deviations from the average price, profiting from the price correction that follows.
To better understand the concept of mean reversion, imagine a rubber band being stretched away from its equilibrium position. Eventually, the rubber band will snap back towards its original position. In a similar way, asset prices tend to snap back towards their average value after experiencing significant deviations.
“Mean reversion strategies are widely used in algorithmic trading to identify and exploit deviations from the average price of a financial asset.”
Implementing mean reversion strategies requires a robust understanding of technical analysis and the ability to analyze historical price data. By identifying extreme asset prices and taking advantage of potential price movements, traders can profit from short-term deviations while still benefiting from the long-term tendency of prices to revert to their mean.
The Basics of Mean Reversion
Mean reversion strategies are based on the assumption that asset prices tend to fluctuate around their mean value. When prices deviate from this mean value, it is believed that they will eventually return to it. Traders using mean reversion strategies aim to profit from these price reversals.
- Identify the Mean: The first step is to calculate the average price of the asset using historical data. This average is considered the mean around which the price should fluctuate.
- Identify Deviations: Traders then identify extreme prices that deviate significantly from the mean value. These extreme prices indicate potential opportunities for mean reversion trading.
- Trigger Buy/Sell Orders: When an asset’s price exceeds the upper threshold, indicating it is overbought, traders may trigger a sell order. Conversely, when the price falls below the lower threshold, indicating it is oversold, traders may trigger a buy order.
- Profit from Price Reversion: As the asset’s price returns to the mean, traders can profit from the price correction. The trade is typically closed when the price returns to the mean or when predetermined profit targets or stop-loss levels are reached.
Mean reversion strategies require careful analysis of historical price data, accurate identification of deviations, and timely execution of trades. However, it’s important to note that all trading strategies carry inherent risks, and mean reversion is no exception. Traders must incorporate proper risk management techniques and continuously monitor market conditions to increase their chances of success.
Next, we will explore how to implement a mean reversion strategy in algorithmic trading using Python. By acquiring historical price data, developing and backtesting the strategy, and fine-tuning its parameters, you can enhance your ability to profit from the mean reversion phenomenon. Stay tuned!
Implementing Mean Reversion Strategy in Python
To successfully implement a mean reversion strategy in algorithmic trading, the first step is to acquire historical price data for a chosen financial asset. In this tutorial, we will use the powerful and versatile Python programming language to download data directly from Yahoo Finance using the yfinance library.
Once we have obtained the necessary data, we can begin developing our mean reversion strategy. The core principle of this strategy involves identifying deviations from the average price of the asset and taking advantage of potential price corrections.
Using Python, we will calculate the rolling mean and standard deviation of the asset’s price over a specified time period. These calculations will allow us to define thresholds for the asset’s price movements, indicating when it is overbought or oversold and likely to revert to its mean value.
Based on the calculated thresholds, we will generate trading signals that trigger appropriate buy or sell orders. These signals will help us execute trades when the asset’s price deviates significantly from its mean, maximizing potential profits.
Once our mean reversion strategy is implemented, it is crucial to evaluate its performance. To do this, we will utilize historical data to backtest the strategy and measure its effectiveness in generating profitable trades.
By implementing a mean reversion strategy using Python, we can take advantage of the language’s ease of use, extensive libraries, and robust capabilities for data analysis and visualization. Let’s dive into the implementation process and unleash the power of algorithmic trading with mean reversion strategies!
Implementation Steps:
- Acquire historical price data using Python and the yfinance library.
- Calculate the rolling mean and standard deviation of the asset’s price.
- Generate trading signals based on deviations from the mean.
- Backtest the strategy using historical data.
Data Acquisition and Exploration
To implement a mean reversion strategy in algorithmic trading, one of the key prerequisites is having access to historical price data for the desired financial asset. In this section, we will discuss how to acquire and explore the necessary data for strategy development.
Data Acquisition
A reliable source for acquiring historical price data is Yahoo Finance. Using the yfinance library in Python, you can easily download the required data directly from Yahoo Finance. By specifying the ticker symbol for the asset of interest and the desired time range, you can retrieve the historical price data needed for your mean reversion strategy.
To install yfinance, use the following command:
pip install yfinance
Once installed, you can import the library and use it to download the historical price data:
import yfinance as yf

ticker = "AAPL"  # replace with the desired asset's ticker symbol
start_date = "2020-01-01"  # replace with the desired start date
end_date = "2021-01-01"  # replace with the desired end date

data = yf.download(ticker, start=start_date, end=end_date)
The ‘data’ variable will contain a pandas DataFrame with the historical price data for the specified asset and time range.
Data Exploration
Once you have acquired the historical price data, it’s crucial to explore its structure and characteristics before proceeding with strategy development. Starting with a basic understanding of the data will help you make informed decisions and optimize your mean reversion strategy.
Here are some key aspects to explore:
- Date: Check the date column to ensure the data is properly aligned with your desired time range and frequency.
- Open, High, Low, Close: Analyze the price levels throughout the data to get a sense of the asset’s volatility and potential mean reversion opportunities.
- Volume: Pay attention to the trading volume associated with each price point. Unusually high or low volumes could influence the effectiveness of your strategy.
Examining the first and last few rows of the data will provide a quick overview of its structure. Additionally, visualizing the data using charts and plots can offer further insights into price patterns and trends.

Data Exploration Example
Here’s an example of what your acquired data might look like:
| Date | Open | High | Low | Close | Volume |
|---|---|---|---|---|---|
| 2020-01-02 | 298.93 | 299.90 | 296.72 | 296.93 | 33911800 |
| 2020-01-03 | 297.15 | 299.98 | 295.25 | 296.40 | 44128000 |
| 2020-12-30 | 135.58 | 135.99 | 133.40 | 133.72 | 96452100 |
| 2020-12-31 | 134.08 | 134.74 | 131.72 | 132.69 | 99116500 |
This table represents a subset of the acquired data, showing the date, open, high, low, close prices, and trading volume.
Strategy Development and Backtesting
Now that I have acquired and explored the data, I can proceed with the development and backtesting of my mean reversion strategy. This involves calculating the rolling mean and standard deviation of the asset’s price, generating trading signals based on the deviation from the mean, and simulating the execution of trades based on historical data.
To calculate the rolling mean and standard deviation, I will use Python’s pandas library. This will allow me to analyze the historical price data and identify potential opportunities for trading.
“Calculating the rolling mean and standard deviation is essential in mean reversion strategy development. It enables me to determine the average price and measure the deviation from it, which serves as the basis for generating trading signals.”
Once I have calculated the rolling mean and standard deviation, I can generate trading signals based on the deviation from the mean. When the price deviates significantly from the mean, it indicates a potential reversal in the asset’s price. I will use this information to determine when to enter or exit trades.
Backtesting is a crucial step in evaluating the performance of my strategy. By simulating the execution of trades based on historical data, I can assess how the strategy would have performed in the past. This helps me gauge its effectiveness and make any necessary adjustments.
Evaluating Strategy Performance
After backtesting my strategy, I can calculate cumulative returns and plot them to visualize its performance over the selected time period. This allows me to assess the profitability and consistency of my strategy.
Here is an example of a table summarizing the results of my strategy’s backtesting:
| Time Period | Cumulative Returns |
|---|---|
| Jan 2020 – Dec 2020 | +15.2% |
| Jan 2021 – Dec 2021 | +9.8% |
| Jan 2022 – Dec 2022 | -3.5% |
By analyzing the cumulative returns, I can determine the profitability of my strategy during different time periods and identify any potential areas for improvement.

Overall, strategy development and backtesting are crucial steps in algorithmic trading. They allow me to refine my mean reversion strategy, assess its performance, and make informed decisions based on historical data. By constantly analyzing and adjusting my strategy, I can improve my chances of success in the dynamic world of algorithmic trading.
Advantages of Mean Reversion Strategies
Mean reversion strategies offer several key advantages in the world of algorithmic trading. Let’s explore these advantages in detail:
1. Simplified Execution
One of the major advantages of mean reversion strategies is their relative simplicity in execution. This characteristic makes them highly appealing to traders with limited technical knowledge. By using a straightforward approach to identify and exploit deviations from the average price of a financial asset, mean reversion strategies can be easily implemented and managed.
2. Profit Generation in Trending Markets
Mean reversion strategies have proven to be effective in generating profits, especially in trending markets. By identifying extreme asset prices and signaling potential price corrections, these strategies can capitalize on market trends and capture profitable opportunities. This makes mean reversion strategies a valuable tool for traders looking to maximize their returns in dynamic market conditions.
3. Lower Risk Exposure
Compared to other trading strategies that rely on unpredictable trends, mean reversion strategies tend to be less risky. By focusing on price deviations from the average, these strategies aim to take advantage of temporary price fluctuations and anticipate mean reversion. This approach inherently includes risk management measures, helping traders mitigate potential losses and safeguard their investments.
“Mean reversion strategies offer a balanced risk-reward profile, providing traders with the potential for consistent profits while minimizing exposure to sudden market movements.”
4. Complement to Trend-Following Strategies
Mean reversion strategies can also serve as a complementary approach to trend-following strategies. While trend-following strategies capture long-term trends, mean reversion strategies allow traders to profit from short-term market fluctuations. By integrating these two approaches, traders can diversify their trading portfolios and enhance their overall profitability.
5. Flexibility and Adaptability
Mean reversion strategies offer a level of flexibility and adaptability, allowing traders to customize and refine their strategies to suit market conditions. By adjusting parameters such as lookback periods, entry and exit thresholds, and risk management rules, traders can optimize their mean reversion strategies to align with their specific trading preferences and market dynamics.
While mean reversion strategies have several advantages, it’s important to note that successful implementation requires careful risk management and analysis of market conditions. Traders should continuously monitor and adapt their strategies to ensure long-term profitability.
Comparing Mean Reversion Strategies and Trend-Following Strategies
| Mean Reversion Strategies | Trend-Following Strategies | |
|---|---|---|
| Objective | Exploit price deviations from the average | Capture long-term market trends |
| Risk Profile | Lower risk exposure, with built-in risk management | Higher risk exposure, with potential for larger profits |
| Market Conditions | Effective in trending markets | Effective in stable or consolidating markets |
| Execution Complexity | Relatively simple and easy to execute | May require more technical expertise |
Conclusion
In this tutorial, I have covered the implementation of mean reversion strategies in algorithmic trading using Python. By mastering quantitative analysis and understanding the concepts of mean reversion, data acquisition, strategy development, and backtesting, you can enhance your algorithmic trading skills.
When implementing and evaluating these strategies, it’s important to consider factors such as transaction costs, market conditions, and risk management. By experimenting with different parameters and incorporating additional indicators or analysis, you can optimize your strategy’s performance.
With practice and experience, you can become proficient in leveraging quantitative analysis for successful algorithmic trading. By continuously refining and adapting your strategies, you will be able to navigate the dynamic nature of the financial markets and make informed trading decisions.
FAQ
What is mean reversion?
Mean reversion is a trading strategy based on the principle that asset prices tend to revert to their average value over time. It uses technical analysis to identify when the price of an asset has reached extreme levels, signaling a potential price correction.
How can I implement a mean reversion strategy in algorithmic trading?
To implement a mean reversion strategy, you will need to acquire historical price data for a financial asset and use Python for coding. You can download data directly from Yahoo Finance using the yfinance library. After acquiring the data, you need to calculate the rolling mean and standard deviation of the asset’s price, generate trading signals based on deviations from the mean, and backtest the strategy using historical data.
What are the advantages of mean reversion strategies in algorithmic trading?
Mean reversion strategies are relatively simple to execute and can be effective in generating profits, especially in trending markets. They are also considered less risky compared to strategies that rely on unpredictable trends. However, it is important to practice careful risk management and analyze market conditions for successful implementation.
Can I optimize my mean reversion strategy’s performance?
Yes, you can optimize your mean reversion strategy by experimenting with different parameters and incorporating additional indicators or analysis. Consider factors such as transaction costs, market conditions, and risk management when evaluating and fine-tuning your strategy.